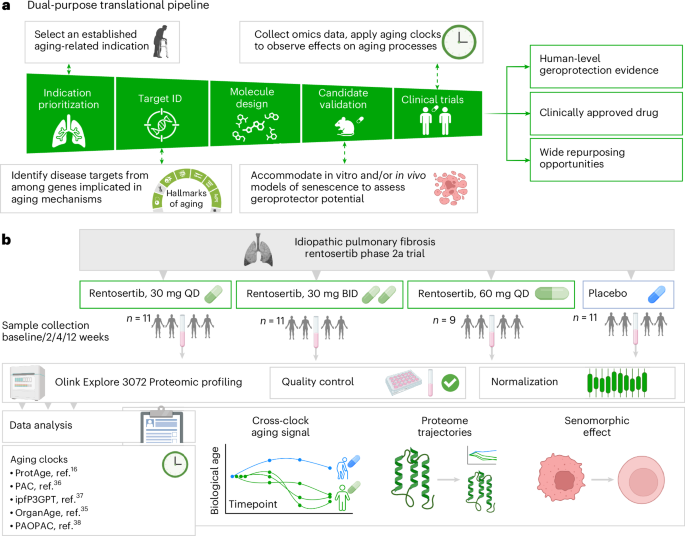
The phase 2a trial of rentosertib in IPF (NCT05938920) is a randomized, double-blind, placebo-controlled trial conducted in 2023–2024 across 21 locations in China that recruited male and female patients older than 40 years, with a confirmed IPF diagnosis and in stable condition. Out of 128 patients screened, 71 were selected to receive 30 mg rentosertib once daily (QD, N = 18), 30 mg rentosertib twice daily (BID, N = 18), 60 mg QD (N = 18) or placebo (N = 17). By the end of trial, 16 patients discontinued treatment. According to the protocol, lung forced vital capacity (FVC) was recorded at the start and end of the trial (12 weeks). Blood samples were collected from the participants at start and end of the trial, as well as at the second and fourth weeks after the start. A total of 43 participants consented to serum proteomic screening, 1 of whom was excluded due to a missing measurement at the end of trial.
The resulting cohort consisted of 42 Asian people with a mean age of 67.1 years. Full summary statistics of the cohort studied in this article can be found in Supplementary Table 1.
Aging clock performance
We evaluated six published proteomic aging clocks on baseline serum samples from 42 participants in the phase 2a IPF trial: Argentieri 2024, Kuo 2024, Han 2026, Galkin 2025, and two variants from Goeminne 2025, one trained to predict chronological age and one trained on mortality risk16,35,36,37,38. The four chronological clocks (OrganAgechrono, ProtAge, ipfP3GPT, PAOPAC) correlated well with actual age (Spearman’s r ∈ 0.70–0.84) and, after ordinary least squares correction for systematic offset, achieved root mean square errors below 4 years (Fig. 2a). The two mortality-based clocks (PAC, OrganAgemortality) showed weaker correlation with chronological age (r ∈ 0.16 − 0.23), consistent with their training objective and the high disease burden of our cohort, which mortality trained models are expected to capture as elevated biological age regardless of calendar age29,39. Bland–Altman analysis confirmed that chronological clocks carried a correctable constant bias, whereas mortality clocks exhibited a proportional bias that overestimated the age of younger participants, which could not be corrected by ordinary least squares (Extended Data Fig. 1). Interclock correlations further reflected this methodological divide: chronological clocks agreed closely with one another (r ∈ 0.78 − 0.89), whereas their correlation with mortality clocks was substantially lower (r ∈ 0.25 − 0.61; Fig. 2b).

a, Chronological age predictions of 42 trial participants at baseline (described in refs. 16,35,36,37,38). The mortality-based PAC and OrganAgemortality clocks show lower accuracy (R2 ∈ 0.03–0.05), as expected given their training objective, compared to all other clocks trained to predict chronological age explicitly (R2 ∈ 0.48–0.65). The statistics for this panel are presented relative to the ordinary least squares regression (black line); the gray area represents the 95% CI for the regression line; r is Spearman’s correlation. b, Correlation between aging clock predictions. Mortality clocks offer a distinct perspective on the participants’ biological age, compared to chronological clocks. P values provided for Spearman’s rank correlations with a two-sided alternative, without correction (total N = 42 participants at baseline for all panels; ^P < 0.10; *P < 0.05; **P < 0.01; ***P < 0.001; †P < 1 × 10⁻⁵).
Despite their differences in calibration and training objectives, all six clocks detected proteomic shifts in response to rentosertib treatment in subsequent analyses, suggesting that the drug may modulate complementary dimensions of biological aging. Anonymized predictions for all timepoints are available in Supplementary Table 2.
Rentosertib-induced aging clock predictions
Across all six clocks, treatment arms showed consistent reduction in biological age relative to baseline, whereas the placebo group showed minimal change or slight increases over the 12-week period (Fig. 3a and Supplementary Table 3). We quantified these shifts as the change in predicted biological age from baseline (ΔBioAge) and compared each treatment arm to placebo at weeks 2, 4 and 12, yielding 54 comparisons per arm (6 clocks × 3 timepoints × 3 regimens). Of these 54 comparisons, 21 reached statistical significance (Q value < 0.10), concentrated at week 4, where 11 of 18 comparisons registered significantly lower ΔBioAge in treated participants (Fig. 3b and Supplementary Tables 4 and 5). A permutation test with patient-level label shuffling confirmed that 21 significant comparisons far exceeded chance expectation (null mean = 0.15; Extended Data Fig. 2). Similar findings persisted when the six participants with higher-grade adverse events were removed from the analysis. Among the three regimens, 30 mg BID produced the most consistent signal (nine significant comparisons), followed by 60 mg QD (seven significant comparisons) and 30 mg QD (five significant comparisons).

a, Biological age trajectories in each treatment arm, centered on baseline measurements. Asterisks: significant changes (one-sided paired Wilcoxon signed-rank test, Benjamini–Hochberg false discovery rate (FDR)) in biological error since baseline. Points show the group mean and error bars (±s.e.m.). b, Differences in biological age shift since baseline (ΔBioAge) compared to the placebo group. All aging clocks record biological age reduction in response to rentosertib, most consistently in the 30 mg BID arm (nine significant reductions at Q value < 0.10, one-sided Mann–Whitney U test, Benjamini–Hochberg FDR) and in week 4 (11 significant reductions). Bars show the group mean ΔBioAge ± s.e.m.; overlaid points are individual patients (all points shown). c, Standardized effect sizes (Cohen’s d) of rentosertib on ΔBioAge at weeks 4 and 12. The effect is observed most consistently at week 4 with the 30 mg BID dosage, by five of the six clocks. Whiskers: 95% CI for Cohen’s d; dashed line: no effect (d = 0). Statistical significance after Benjamin–Hochberg correction is indicated with symbols: ^Q < 0.10, *Q < 0.05. Number of participants at each timepoint (n): placebo (11), 30 mg QD (11), 30 mg BID (11) and 60 mg QD (9).
We also tested whether baseline body mass index (BMI) correlated with the magnitude of biological age change, reasoning that fixed dosing could yield lower effective exposure in patients with higher bodyweight. Spearman correlations between BMI and ΔBioAge were computed within each treated arm for all six clocks, yielding 54 tests total. Only three tests reached nominal significance (P < 0.05), and none remained after multiple testing correction (all Q values > 0.25), confirming that the observed biological age reductions were not modulated by BMI within the studied range.
By week 12, the number of significant comparisons decreased, indicating partial attenuation of the initial proteomic response. Direct comparison of age predictions between weeks 4 and 12 indicated that ‘plateau’ would be a more appropriate term, as no arm–clock combination showed significant (paired Wilcoxon, P < 0.05) shift in predicted age.
The two classes of clocks (chronological age and mortality trained) responded differently to dosing regimens (Fig. 3a,b). The 60 mg QD group, which showed the greatest FVC improvement in the original trial report, yielded significant biological age reduction across all four chronological clocks at week 4 (ΔBioAge ∈ −2.71 to −3.46 years, Q value < 0.10) but no significant changes in either mortality clock. In contrast, the 30 mg BID regimen was detected by both chronological and mortality clocks, making it the arm with the broadest cross-clock agreement.
Analysis of standardized effect sizes confirmed that week 4 represents the timepoint of maximal aging clock consensus, with the 30 mg BID regimen showing consistent effect sizes across five of six clocks (Extended Data Fig. 3). The twice-daily administration in the 30 mg BID group seemed to enhance aging-related effects compared to the equivalent total daily dose given once (60 mg QD), suggesting that maintaining steady drug levels throughout the day may be important for the aging process modulation. Analysis of standardized effect sizes (Cohen’s d) confirmed this pattern: at week 4, five of six clocks showed negative effect sizes for 30 mg BID, whereas ΔBioAge reductions in other regimens were detected by fewer clocks (Fig. 3c).
Organ-specific variants of OrganAge from ref. 35 provided additional granularity. Although the chronological organ clocks detected no significant (Q value < 0.10) ΔBioAge shifts (Extended Data Fig. 4), several mortality-based organ clocks did. In particular, all timepoints across all treated arms showed significantly lower predicted age relative to placebo with the artery clock (ΔBioAge ∈ −6.95 to −16.57 years; Extended Data Fig. 5). The stomach, brain, pancreas and immune clocks also registered significant reductions in select arms.
These exploratory findings suggest that rentosertib treatment is associated with a broad proteomic shift toward younger predicted biological age profiles, with the 30 mg BID regimen producing the most consistent signal across methodologically diverse clocks. The temporal pattern of peak effects followed by a plateau warrants further investigation to determine whether it reflects pharmacodynamic adaptation, a new homeostatic equilibrium or a limitation of the 12-week observation window.
Rentosertib-induced proteomic trajectories
To identify proteins whose serum levels changed in response to treatment, we fitted linear mixed-effects models (LMEM) for each of the 2,841 measured proteins, with sex and BMI included as fixed-effect covariates alongside group-by-time interaction terms to capture trajectories that diverged from placebo over the 12-week trial period.
Rentosertib altered the expression trajectories of 326 proteins significantly (Q value < 0.10) across all treatment groups, compared to only 2 in the placebo group (Fig. 4a and Supplementary Table 6). Most changes were regimen-specific: 237 proteins responded only in one arm. The 30 mg BID group exhibited the broadest proteomic response, with 142 uniquely affected proteins, consistent with its strong cross-clock aging signal. The 30 mg QD regimen, by contrast, produced only one significant time-dependent change (IDO1, upregulated). A subset of 89 proteins showed concordant directional changes in two or more treatment groups, suggesting a core set of pathways affected by TNIK inhibition regardless of regimen (Fig. 4a).

a, UpSet diagram of all significant (Q value < 0.10) changes in protein levels. Out of 326 proteins affected by rentosertib, 89 display a codirected trajectory in two or more treated arms. The 30 mg BID group is associated with the most unique signature, containing 142 proteomic changes not observed in other groups. b, Individual protein trajectories throughout the trial. The presented proteins were selected as those with the most significant (Q value < 0.10) time-dependent expression shift in two or more regimens, (see Extended Data Fig. 3 for a full list), according to the LMEM analysis. Shaded areas: s.d. of the mean.
Individual protein trajectories demonstrated the nature of these changes (Fig. 4b). Among the most prominently downregulated proteins were drivers of fibrosis and extracellular matrix (ECM) remodeling, including COL1A1, MMP10 and FAP. Conversely, several proteins involved in cellular metabolism and stress resistance, including NAMPT (the rate-limiting enzyme in NAD+ biosynthesis), the antioxidant SOD2 and the detoxification enzyme ALDH1A1. Among the decreased proteins, we also observed reduced levels of PDGFB—a growth factor involved in proliferative signaling. A heatmap of the 90 most affected proteins confirmed the cross-arm temporal patterns, with the 30 mg BID and 60 mg QD regimens producing more pronounced and sustained shifts than 30 mg QD (Extended Data Fig. 6).
Stability of rentosertib’s effects
The attenuation of the aging clock signal between weeks 4 and 12 warranted exploration of whether rentosertib’s effect genuinely fades or whether this pattern reflected a limitation of our aging clock analysis.
To address this, we recalculated the LMEM with time as a categorical variable to capture nonlinear proteomic trajectories, classifying each protein’s response as sustained, delayed or transient (Supplementary Table 7 and Methods). In the 30 mg BID and 60 mg QD arms, only 5–9% of proteomic shifts were transient (Extended Data Fig. 7a). This confirms that the proteomic response to rentosertib at effective doses continues to develop through week 12 rather than fades. But among the proteins used in four aging clocks with publicly available feature weights (OrganAgechrono, OrganAgemortality, PAC, ProtAge) proteins with a sustained trajectory are overrepresented with odds ratio = 4.65 in 30 mg BID, and 2.19 in 60 mg QD groups (Supplementary Table 8 and Extended Data Fig. 7b). The proteomic changes most relevant to biological aging are thus among the more durable treatment effects.
This finding leads to a paradoxical conclusion: sustained modulation of aging-relevant proteins should maintain or deepen the signal, yet all clocks register a plateau. To resolve this matter, we inspected the key contributors to biological age shifts from baseline to week 4 and week 4 to week 12. We identified a list of 35 unique proteins, whose normalized protein expression (NPX) shift contributed >3% of the total BioAge shift at either timeframe-clock combination. At both timeframes, the most important feature was LTBP2—a master regulator of fibrosis40 in the TGF-β signaling axis, which is coincidentally the only important feature present in all six clocks (Supplementary Table 9). Other important features spanned inflammaging (AGER41), neurodegeneration (NEFL42), reproductive aging (FSHB43,44) and cellular senescence (CXCL945), as well as a range of fibrotic markers (SPP1, KRT1940, ELN) and other ECM proteins (COL6A3, MMP12). In most cases, the highlighted processes cannot be separated clearly and the specified genes may be attributed to several categories at once.
This heterogeneity and the oversized influence of fibrotic proteins on the aggregate clock signal presents a challenge in distinguishing between the drug’s therapeutic and potential geroprotective effects. Resolving this entanglement requires comparison with other antifibrotics acting through distinct mechanisms, such as pirfenidone or nintedanib, for which comparable proteomic data is not currently available. However, we were able to address this important matter through several complementary analyses presented in the next section.
Isolating geroprotective effects
On their own, proteomic clocks cannot answer the question of whether the biological age reductions reflect general aging modulation per se or are secondary to rentosertib’s anti-fibrotic activity. An indirect indication, however, can be obtained from inspecting the degree of dissociation between clinical efficacy and aging clock responses. If clock changes were merely downstream of reduced disease burden, the regimen with the greatest respiratory improvement should also show the strongest aging reversal. Instead, the opposite pattern emerged: the 60 mg QD group, which produced the largest FVC gains in the original trial report, showed less consistent ΔBioAge than the 30 mg BID group. This dissociation was supported further by regression analysis: ΔFVC explained minimal variance in ΔBioAge across all six clocks (median R2 = 0.06, range ∈ 0.01–0.18, N = 42). Although FVC is an incomplete proxy for overall disease status, the consistently low explanatory power across clocks argues against a simple disease improvement explanation.
To test whether rentosertib’s proteomic effects oppose normal aging trajectories independently of its anti-fibrotic action, we compared treatment-induced protein changes to age-associated protein changes in 55,319 older adults from the United Kingdom (UK) Biobank. Of 2,832 proteins shared between the two datasets, 758 showed significant age-dependent expression in UK Biobank (Q value < 0.05, |coefficient | > 0.005 NPX per year). Rentosertib-modulated proteins were enriched 1.74-fold for age-associated proteins relative to the background rate (P < 0.001). For each treatment arm, we then correlated the direction of treatment-induced changes with the direction of normal aging. The 30 mg BID regimen showed a significant negative correlation (Spearman’s r = −0.30, P < 0.01), indicating that this regimen preferentially reversed age-associated proteomic trajectories. The 60 mg QD regimen showed no such correlation (r = –0.097, P = 0.37), despite its superior FVC response. In the placebo group, proteomic changes tracked the direction of normal aging, consistent with disease progression accelerating age-related proteomic decline. This pattern supports the hypothesis that rentosertib may alter aging processes independently of fibrotic processes. However, we acknowledge the limitations of such computational and indirect evidence and intend to seek direct experimental validation.
Protein–protein interaction (PPI) analysis provided further insight into how the two regimens diverge at the pathway level. The 30 mg QD group was excluded from this analysis due to insufficient significantly affected proteins (Fig. 4a). In the remaining arms, the 60 mg QD group affected 184 proteins (95 unique) and the 30 mg BID group affected 231 proteins (142 unique). Both regimens modulated ECM remodeling and immune function clusters (Supplementary File 1), but their unique protein sets differed in character. Proteins affected exclusively by 30 mg BID were enriched for metabolic pathways, including pentose phosphate, glutathione and cholesterol metabolism (Extended Data Fig. 8a), whereas those unique to 60 mg QD were enriched for Wnt signaling and broader immune activities (Extended Data Fig. 8b). This pathway-level divergence offers a potential mechanistic explanation for why the two regimens differ in their aging clock profiles despite comparable total daily doses.
Together, these analyses suggest that rentosertib’s effects on biological age cannot be attributed fully to its anti-fibrotic activity. Definitive confirmation, however, will require studies in non-IPF populations where severe fibrosis cannot confound interpretation, such as in other patients with aging-related diseases or generally healthy long-living people.
Rentosertib’s senomorphic effect
As an independent line of evidence for rentosertib’s potential to suppress cellular senescence at the proteomic level, we performed geneset enrichment analysis (GSEA) using three established senescence signatures: SenMayo (91 proteins measured), CellAge-upregulated (93 proteins known to promote senescence) and CellAge-downregulated (116 proteins known to inhibit senescence). Proteins were ranked by the strength and direction of their treatment response in each arm, derived from LMEM time coefficients (Supplementary Tables 10–13 and Methods).
Placebo and treated groups showed opposite senescence trajectories (Fig. 5a,b). In the placebo group, SenMayo proteins were enriched significantly among upregulated proteins (normalized enrichment score (NES) = 1.48; Q value < 0.01), with the leading edge (biggest contributors to NES) comprising ECM remodelers (MMP1, MMP3, MMP9, MMP10, MMP13), interleukins (ILs) (IL1B, IL6, IL10, IL13), growth factors (FGF7, IGFBP4, EGF, GDF15) and chemokines (CCL20, CXCL1, CXCL3). All treated groups showed the reverse pattern: significantly negative SenMayo scores and significantly positive CellAge-downregulated scores (Q value < 0.05), except for 60 mg QD in SenMayo (Q value = 0.17; Supplementary Table 14). Seven proteins appeared in the SenMayo leading edge of every treated arm: EREG, ESM1, IGFBP4, ITGA2, MMP10, MMP13 and SPP1 (Fig. 5c). In the CellAge-downregulated set, FOS and DPY30 showed discordant dynamics between placebo and all treated groups (Fig. 5d). These circulating protein patterns are consistent with a senomorphic effect of rentosertib, previously shown in vitro46.

a, Preranked lists were prepared using LMEM coefficients of all Olink proteins. GSEA shows a growing abundance of senescence markers in the Placebo group with an opposite effect observed in all treated arms. b, Dotplots displaying the significance of aging signature reversal in treated patients. The largest SenMayo signature of aging shows the most consistent negative effect of rentosertib on the senescence-associated proteins. c, Venn diagram of leading-edge proteins associated with each trial arm for the SenMayo geneset (124 genes). The 30 mg BID group has the largest total number (N = 22) of downregulated senescence markers. The total intersection of all leading edges contains proteins upregulated in placebo and downregulated in all treated groups: EREG, ESM1, IGFBP4, MMP10, MMP13, SPP1. d, Venn diagram of the leading-edge proteins for the CellAgedown geneset (475 genes) associated with each trial arm. In this set of proteins known to inhibit senescence, five proteins show discordant dynamics between placebo and all treated groups: FOS, MAPK9, NAMPT, SDC1, TRDMT1. e, Rentosertib affects genes featured in five KEGG-MEDICUS genesets representing growth factor and cytokine signaling. All treated groups show consistent downregulation of growth factor axes (GF-RTK-PI3K, GF-RTK-RAS-ERK, GF-RTK-RAS-PI3K), as well as receptor tyrosine kinase-phospholipase signaling (RTK-PLG-IP3R). Conversely, the JAK–STAT axis is upregulated in treated participants. f, The growth factor signaling suppression in response to rentosertib is significant (Q value < 0.25) in all treated groups. The upregulation of the JAK–STAT axis associated with fibrosis is significantly upregulated only in 30 mg QD and 60 mg QD groups, potentially explaining more consistent aging clock response in the 30 mg BID group where no significant upregulation is seen. Neg, negative; Pos, positive.
We next examined whether rentosertib modulates broader signaling pathways implicated in aging. GSEA against the Kyoto Encyclopedia of Genes and Genomes (KEGG) Medicus collection (658 genesets, filtered to those with >25 proteins measurable by Olink) identified five significantly enriched pathways, all involving growth factor signaling: RTK–PLCG–ITPR, and pathways involving MAPKs, RAS, ERK and PI3K–Akt (Fig. 5e,f). These pathways were upregulated in placebo but downregulated in all treated arms (Q value < 0.25). Growth factor and nutrient-sensing pathways are well-established drivers of aging, targeted by caloric restriction and rapamycin, so their coordinated suppression by rentosertib provides a plausible mechanistic link to the observed reduction of biological age. At a more stringent threshold (Q value < 0.10), the 30 mg BID arm was distinctive in that it did not upregulate the cytokine–Janus kinase-signal transducer and activator of transcription (JAK–STAT) axis significantly, whereas both 30 mg QD (Q value < 0.05) and 60 mg QD (Q value < 0.10) did, with IL2, IL3, IL4 and IL12 subunits forming the leading edge. As JAK–STAT-mediated cytokine signaling promotes fibrosis through STAT activation47, the absence of this signal in the 30 mg BID arm may partly explain its more consistent aging clock response.
GSEA against the larger Reactome collection (1,787 genesets, 145 with >25 proteins in our data) identified 64 significantly enriched pathways across all arms at Q value < 0.25, with 36 remaining at Q value < 0.10 (Fig. 6 and Supplementary Table 14). All pathways showed concordant regulation: no pathway had opposite enrichment signs between two treated arms, and no pathway shared a sign between any treated arm and placebo. The 30 mg BID group again showed the broadest response, with 40 enriched pathways. ECM remodeling pathways were downregulated in the 30 mg BID and 60 mg QD groups, as expected from rentosertib’s anti-fibrotic activity. Several additional pathways with no direct ECM connection were also affected in both arms: MET signaling (Q value < 0.10, NES ∈ −1.64 to −1.63), Gαs signaling (Q value < 0.10, NES ∈ −1.65 to −1.56), death receptor signaling (Q value < 0.25, NES ∈ −1.64 to −1.39) and regulation of insulin-like growth factor (IGF) transport and uptake by IGF binding proteins (IGFBPs) (Q value < 0.10, NES ∈ −1.70 to −1.66). In the 30 mg BID group specifically, transcriptional regulation by TP53 (Q value = 0.17, NES = 1.40) and fatty acid metabolism (Q value = 0.09, NES = 1.45) were upregulated (Fig. 6).

a, A total of 57 unique Reactome pathways are enriched significantly in trial participants, including 23 enriched in two or more arms. b, The 30 mg BID arm displays the broadest modulation of biological processes, with a total of 40 significantly (Q value < 0.25) enriched pathways. c, Pathways with a significant (Q value < 0.10) enrichment in at least two trial arms. Arrows: shifts from placebo-level enrichments. Full Reactome GSEA statistics are available in Supplementary Table 14.
The IGFBP pathway warrants particular attention given the appearance of IGFBP4 in the SenMayo leading edge and the established role of IGF signaling in aging. The shared leading edge for the 30 mg BID and 60 mg QD arms contained 15 proteins, including the senescence- and fibrosis-associated proteins CCN1, FN1, IGFBP3, IGFBP4 and SPP1 (Extended Data Fig. 9a and Supplementary Table 15). Among these, SPP1 and FN1 showed significant downward trends in both arms (Q value < 0.10), whereas CCN1 reached significance only in the 60 mg QD group (Q value < 0.05). To capture nonlinear shifts that time interaction coefficients may miss, we assessed baseline-to-timepoint changes directly for all available IGFBPs, IGF1R and IGF2R (ten proteins total; Extended Data Figs. 9b and 10). Six proteins were downregulated significantly relative to baseline across all treated groups: IGFBP-1, IGFBP-4, IGFBP-6 and IGFBP-7, IGFBPL1 and CCN1, with CCN1, IGFBP4 and IGFBPL1 showing the most consistent reductions across all three regimens. These coordinated shifts in IGF-axis proteins suggest a potential mechanism linking TNIK inhibition to the metabolic and senescence-related components of biological aging.