Plasmid construction
All plasmids were assembled using the Uniclone One Step Seamless Cloning Kit (Genesand Biotech). In brief, DNA fragments were obtained by PCR amplification or gene synthesis. PCR was performed using KOD One PCR Master Mix (TOYOBO) with primers designed to contain 15–20 bp overlapping homology arms. The amplified fragments were purified and assembled via the Gibson method according to the manufacturer’s protocol. Assembled products were transformed into E. coli DH5α, and positive clones were verified by Sanger sequencing. Plasmids for HEK293T cell transfection were extracted using EndoFree Plasmid Kits (Qiagen) or the EasyPure HiPure Plasmid MiniPrep Kit (EM111, TransGen Biotech). Plasmids for rice protoplast transformation were extracted using the Wizard Plus Minipreps DNA Purification System (A7100, Promega). All primers were synthesized by Beijing Tsingke Biotech and BGI Tech Solutions (Beijing Liuhe). Plasmids sequence confirmation was performed by Beijing Tsingke Biotech and CoWin Bioscience.
Cell culture and transfection
HEK293T cells were obtained from ATCC (CRL‑3216) and used within ten passages of receipt. HEK293T cells are cultured in DMEM (Gibco) supplemented with 10% (vol/vol) FBS (Gibco) and 1% (vol/vol) penicillin–streptomycin (Gibco). For HEK293T cells transfection, 6 × 10⁴ cells per well were seeded into 48-well poly-d-lysine-coated plates (Corning) in the absence of antibiotic. After 16–24 h, plasmids were transfected into the cells. For TRAC site transfection, cells were transfected with 1 μl jetPRIME transfection reagent (Polyplus), 300 ng PE2 plus 30 ng pegRNA1 and 30 ng pegRNA2 plasmids; 300 ng donor plasmid and 37 ng large serine recombinase per well were transfected at a 60–80% cell confluency. Cells were washed once with PBS and followed by DNA extraction 48 h after transfection.
Transient expression in tobacco leaves
The reporter plasmids or library were introduced into electroporation-competent A. tumefaciens EHA105 cells harboring the helper plasmid S726 via electroporation20. Following transformation, the cells were resuscitated in liquid medium at 28 °C with shaking at 220 rpm for 2 h before being plated on selective solid medium. After 2 days of incubation, a single colony was picked and inoculated into liquid Luria–Bertani medium for overnight culture. The bacterial cells were then collected and resuspended in an infiltration buffer (10 mM MgCl2, 10 mM MES, 200 μM acetosyringone) to adjust the optical density at 600 nm (OD600) for subsequent infiltration. The bacterial suspensions containing the reporter or library and the gene-silencing suppressor P19 were mixed in a 1:1 volume ratio immediately before infiltration. For each experimental group, three independent biological replicates were prepared.
Tobacco plants (N. benthamiana) with healthy growth status were selected for agroinfiltration. To facilitate stomatal opening, the plants were pre-irradiated for at least 1 h under light before infiltration. The third or fourth fully expanded leaves were chosen for injection. A 1 ml needleless syringe was used to draw the mixed bacterial suspension. The syringe was pressed gently against the abaxial side (undersurface) of the leaf, and slight pressure was applied to infiltrate the suspension into the leaf mesophyll, creating a transient water-soaked area. The infiltrated zones were marked immediately. After infiltration, all treated plants were returned to the greenhouse and maintained under standard growth conditions (25 °C, 16 h light/8 h dark cycle) for subsequent analysis.
Quantification of recombination activity using a dual-luciferase reporter system
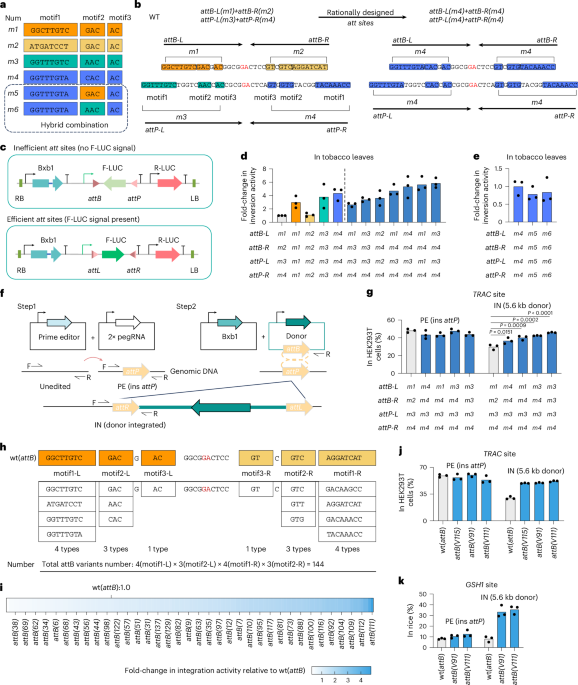
To quantitatively assess the inversion activity of Bxb1 with rationally designed attachment sites, we engineered a dual-luciferase reporter system. As illustrated in Fig. 1c, the reporter construct contains three expression cassettes within a binary vector: (i) the Bxb1 expression cassette, (ii) an F-LUC expression cassette flanked by attB and attP sites, and (iii) a Renilla luciferase (R-LUC) expression cassette serving as an internal control. In this configuration, the F-LUC coding sequence is oriented in the reverse direction relative to the promoter; thus, expression occurs only upon successful inversion mediated by Bxb1.
To validate the system, we infiltrated A. tumefaciens harboring the reporter plasmid expressing either WT_Bxb1 or a catalytically dead Bxb1 (deadBxb1) into N. benthamiana leaves. At 48 h post-infiltration, luminescence was measured. Robust F-LUC signals were detected exclusively in the presence of WT_Bxb1, while the deadBxb1 control yielded background levels, confirming that the observed signal is strictly dependent on Bxb1-mediated recombination.
Luciferase assays
The luciferase activity was measured using a Dual-Luciferase Reporter Assay System (Promega) according to the manufacturer’s protocol. All assays were performed in white 96-well plates (Sangon Biotech, 400 µl, high adsorption) with a SuperMax 3000AL luminometer (Flash Biotech).
At 48 h after agroinfiltration, one-leaf discs (1 cm in diameter) were collected from each tobacco sample, flash-frozen in liquid nitrogen and ground to a fine powder using a tissue disruptor. The powdered tissue was lysed in 300 µl of 1× cell lysis buffer by vertexing thoroughly, followed by incubation at room temperature for 5 min. The lysate was then centrifuged at 12,000 × g for 10 min at 4 °C to remove debris. A 10 µl aliquot of the supernatant was transferred to a 96-well plate for luminescence measurement.
To initiate the reaction, 50 µl of Luciferase Reaction Substrate I (LRS I) was added to each well and mixed for 10 s, and the Firefly luminescence signal was recorded as the average of three consecutive readings. Immediately afterward, 50 µl of Luciferase Reaction Substrate II (LRS II) was added to the same well to quench the Firefly reaction and simultaneously activate the R-LUC reaction. After mixing for 10 s, the Renilla luminescence was similarly measured as the average of three readings. All experiments included at least three independent biological replicates.
PCR-NGS assay to quantify the integration activity of recombinase
To quantitatively evaluate integration efficiency in human and rice genomes, we used a targeted PCR-NGS assay as reported before5. The most crucial design is where the donor vector was engineered to include a universal reverse primer binding site, enabling the simultaneous amplification of three genotypes in a single multiplexed PCR: the unedited WT genome, the prime-edited intermediate (attB/attP installed) and the successfully integrated product. To minimize PCR bias, the reverse primer was positioned to ensure that the amplicons from the edited intermediate and the final integration event were of identical length. PE (%) represents the overall efficiency of successful attP installation by the prime editing system, including both alleles that remain as the prime-edited intermediate and alleles that subsequently underwent Bxb1-mediated recombination: PE (%) = [reads (attP insertion) + reads (Integrated)]/[reads (Unedited) + reads (attP insertion) + reads (Integrated))] × 100. IN (%) represents the recombination efficiency of Bxb1 among all successfully prime-edited alleles: IN (%) = reads (Integrated)/[reads (attP insertion) + reads (Integrated)] × 100. The final donor integration efficiency is calculated as PE (%) × IN (%).
NNK mutagenesis and tobacco screening of Bxb1 variants
To identify Bxb1 variants with enhanced activity, we performed saturation mutagenesis via NNK codon scanning targeting the N-terminal domain (residues 2–151) of the Bxb1 recombinase. The N-terminal domain was divided into 15 overlapping pools (NNK1–NNK15), each covering 10 consecutive codons. For every pool, 10 forward primers were designed, each containing a single NNK mutation at 1 of the 10 targeted residues, along with a 15 bp 5′ overlap sequence for subsequent Gibson assembly and a 14 bp 3′ primer-binding region. These primers were paired with a common reverse primer to amplify the T-DNA2 plasmid via inverse PCR. The resulting amplicons were gel purified, pooled in equimolar ratios and reassembled by Gibson assembly following DpnI treatment to remove methylated parental templates. The assembled libraries were transformed into TOP10 chemically competent cells (Tsingke). Library quality was assessed by determining library size and mutation bias. Theoretically, each codon yields 32 variants (4 × 4 × 2); thus, a coverage depth of 100× required a library size of at least 32,000 clones per pool. Fifteen libraries were introduced into electrocompetent A. tumefaciens strain EHA105 carrying the S726 helper plasmid, ensuring a minimum of 32,000 colony-forming units per transformation. After 2 days of culture, bacterial suspensions were adjusted to OD600 = 0.02. For in planta screening, Agrobacterium cultures were infiltrated into N. benthamiana leaves at a density calculated to deliver approximately 107–108 cells per leaf, with 3 biological replicates per library. Leaves were collected 2 days post-infiltration for genomic DNA extraction. Data are representative of two independent experiments (using tobacco leaves at different growth stages), each performed in triplicate, resulting in a total of six datasets for analysis.
Two sets of PCR were performed using either F1/R or F2/R, and NGS was used to identify enriched, high-activity variants. Following sequencing, we first quantified the read proportions for each variant in the total (F2/R) and post-recombination (F1/R) samples. The enrichment score was calculated as enrichment = [Ratio of mutant in (F1 + R)]/[Ratio of mutant in (F2 + R)]. A higher enrichment value directly correlates with elevated recombinase activity of the variant. After filtering for variants with enrichment values greater than 1 across all 6 groups, the top 23 candidates ranked by average enrichment in Repeat 1 were selected for subsequent activity validation in rice protoplasts. We expanded our validation by randomly selecting additional candidates from the enriched pool to include all those shown in Fig. 2c.
Rice protoplasts isolation and PEG-mediated transfection
Rice protoplasts are isolated from 11-day-old etiolated seedlings grown on 1/2 MS medium in the dark at 28 °C by finely slicing leaf sheaths into 1 mm segments, which are first equilibrated in 0.6 M mannitol buffer and then enzymatically digested in the dark using a vacuum infiltration step (30 min) followed by gentle shaking at 28 °C (45 rpm) for 4 h. Post-digestion, protoplasts are filtered through a 300-mesh sieve, purified via two slow-acceleration centrifugation cycles (170 × g, 3 min) in W5 solution and resuspended in MMG buffer for counting, targeting a density of 8 × 10⁴ to 2 × 10⁵ cells per 100 μl. For transfection, plasmid DNA (>1 μg μl−1) is mixed with the protoplast suspension, followed by dropwise addition of 1.1 volumes of 40% PEG solution (pH 7.5–8.0); after incubation at 28 °C in the dark for 20 min, the reaction is terminated with excess W5 solution. Transfected protoplasts are washed, resuspended in 1 ml W5 containing 50 μg ml−1 carbenicillin and cultured at 28 °C in the dark for 48 h. Finally, protoplasts are collected by centrifugation for genomic DNA extraction, followed by NGS analysis to determine the prime editing and integration efficiencies.
Rice genetic transformation and identification of edited events
Rice genetic transformation was performed by sterilizing seeds and inducing calli on MS+ medium in the dark at 28 °C for approximately 28 days, followed by subculture on MS medium for 7 days; subsequently, well-grown calli were co-cultivated with A. tumefaciens harboring all-in-one plasmid in liquid NBCO medium supplemented with 20 mg l−1 acetosyringone at 22 °C on a shaker (44 rpm) for 30 min, washed 5 times with sterile water, dried and cultured on co-cultivation medium with filter paper at 22 °C in the dark for 3 days, then washed over 10 times with carbenicillin-containing sterile water, dried and subjected to 2 rounds of selection on selective medium at 28 °C in the dark (15 days per round), after which selected calli were transferred to pre-differentiation medium for 7 days and then to differentiation medium for 3 days in the dark, followed by light culture until green shoots emerged, and finally rooted transgenic plantlets were grown on 1/2 MS medium under light for about 7 days before being transplanted to a controlled-environment growth chamber following molecular confirmation.
Genomes from individual regenerated T0 rice seedlings were extracted using an SDS-based plant DNA purification method. Transgenic positive seedlings were identified by PCR using primers noted in Supplementary Table 1 (‘Primers’ sheet). Excision and precise integration events were also analyzed by PCR using primers noted on the same sheet.
Targeted library preparation and off-target analysis via Tn5-based NGS
Genomic DNA from precisely integrated rice plants was fragmented using a customized Tn5-based tagmentation strategy to specifically detect potential off-target insertions of the donor cassette. The TruePrep Tagment Enzyme (Vazyme S601) was pre-loaded exclusively with an Adapter Mix corresponding to the N5 sequence to form the transposome complex (TTE Mix), which was subsequently used to fragment the genomic DNA. Following purification with VAHTS DNA Clean Beads (1× ratio), the libraries were amplified using a primer pair consisting of the donor-specific primer with the N7 adapter sequence and the universal N5 adapter primer.
Raw sequencing data were subjected to a stringent quality control pipeline to identify illegitimate donor integrations. After demultiplexing and adapter trimming, reads with base quality scores below 14 were removed to ensure high-confidence downstream analysis. To eliminate noise from unexcised T-DNA, read2 sequences containing complete attP sequences at both termini were filtered out, and all remaining sequences were trimmed to remove the region upstream of the ‘dinucleotide’ motif (including the 5′ attP sequence), retaining only the genomic sequence downstream of this junction for alignment. Trimmed reads were mapped to the rice Y88s reference genome using Bowtie2, and alignments with a mapping quality (MAPQ) score <23 were discarded to retain only high-confidence genomic localizations. PCR duplicates were removed based on identical read1 start positions, representing unique genomic cleavage and ligation events. Finally, a deduplicated list of potential integration events was generated by summing reads for each unique read1 start position and dinucleotide site, and all retained reads were summarized by their genomic coordinates and orientation (top or bottom strand) to consolidate the final catalog of donor insertion sites, thereby revealing any off-target integration events.
ONT whole-genome sequencing and data analysis
High-molecular-weight genomic DNA was extracted from young leaves of two independently selected positive edited rice plants. DNA quality and concentration were assessed by agarose gel electrophoresis, NanoDrop spectrophotometry and Qubit fluorometry.
Sequencing was performed using the PromethION 48 platform (ONT) with R10.4.1 flow cells. Sequencing libraries were prepared using the ONT ligation sequencing kit according to the manufacturer’s instructions. In brief, genomic DNA was subjected to DNA repair and end preparation, followed by adapter ligation. The resulting libraries were loaded onto ONT flow cells and sequenced to generate long-read whole-genome sequencing data.
Raw sequencing data were base called using Guppy (ONT), and reads with low quality were removed. Sequencing quality metrics, including total yield, mean Q score and read N50, were calculated for each sample.
To identify potential donor integration sites, the donor sequence was first aligned to the rice reference genome using minimap2 (parameter: -x asm20). Genomic regions showing high sequence similarity to the donor sequence (sequence identity ≥90% and alignment length >100 bp) were defined as homologous regions and excluded from subsequent analyses. All ONT sequencing reads were then independently aligned to both the donor sequence and the rice reference genome using minimap2 (parameter: -ax map-ont). A custom Python script was used to analyze all reads that aligned to the donor sequence. Reads were retained if the regions not aligned to the donor could be mapped to the rice reference genome, with no overlap between the donor-aligned and genome-aligned segments, and if the combined coverage of the donor and genomic alignments accounted for more than 90% of the read length.
For each retained read, the genomic alignment immediately adjacent to the donor-aligned segment was defined as the candidate integration junction. Reads spanning a single donor–genome junction yielded either a left or a right candidate integration site, whereas reads spanning the entire donor insertion contained both left and right integration junctions. All candidate integration sites identified from these reads were subsequently compared with the previously defined homologous regions, and sites overlapping homologous regions were excluded. The remaining loci were considered potential donor integration sites.
Finally, all off-target sites identified by NGS were independently evaluated using the ONT sequencing data. Reads spanning each off-target locus were extracted and examined for the presence of donor integration.
Genotyping of T1 rice plants
Genomic DNA was extracted from the leaf tissues of 439 T1 plants for genotyping. The target region was amplified using the F3/R3 primer pair, and the PCR products were separated on a 2% agarose gel. The genotypes of the T1 plants were determined based on the sizes of the amplified bands. To confirm the editing outcomes and verify the sequence of the integrated allele, amplicon nanopore sequencing of the PCR products was performed by Beijing Tsingke Biotech.
Statistical analysis
Data analysis was performed using GraphPad Prism 10.1.1. All quantitative data are presented as mean ± s.d. Statistical significance was determined using one-way analysis of variance (ANOVA) followed by Dunnett’s multiple comparisons test.
Reporting summary
Further information on research design is available in the Nature Portfolio Reporting Summary linked to this article.